Maps That Turn
Data Into
Decisions.
Custom Web GIS platforms, interactive mapping dashboards, and geospatial analytics systems — engineered to transform raw location data into the spatial intelligence your organization needs to outthink the competition. Every coordinate in your data is a competitive advantage waiting to be unlocked.

Delivered
Served
Layers
Query Time
Every Layer.
Every Use Case.
From a single interactive map embedded in a website to a full enterprise geospatial intelligence platform handling millions of data points — we engineer the complete GIS stack. Frontend mapping, spatial database design, tile serving, analytics pipelines, and real-time data feeds — all under one roof, with one team who understands spatial data from coordinate to conclusion.
Interactive Web Maps
Pixel-perfect browser-based maps with custom tile layers, dynamic markers, polygon overlays, clustering, heat maps, and smooth zoom transitions — built with Leaflet.js, Mapbox GL JS, or OpenLayers. Fully responsive and mobile-optimized for any device.
Start a Mapping ProjectGeospatial Data Visualization
Transform raw coordinate data, shapefiles, GeoJSON, and raster layers into stunning visual analytics — choropleth maps, isochrone analysis, 3D extrusions, dot density maps, and animated time-series playbacks that reveal patterns invisible in tables.
Visualize Your DataSpatial Database & Backend
PostGIS-powered spatial databases with lightning-fast proximity queries, intersection analysis, buffer calculations, routing graphs, and topology validation. Schemas that handle millions of geometries — and APIs that serve them in milliseconds.
Design Your Spatial DBReal-Time Location Tracking
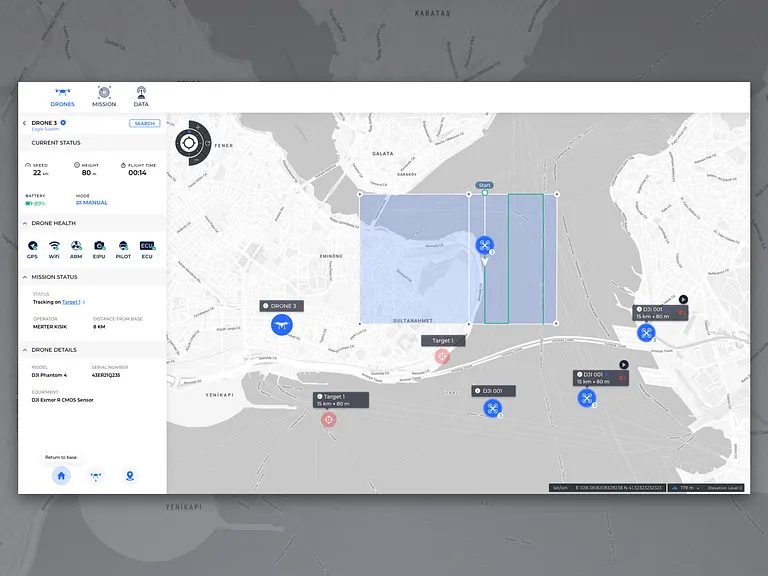
Live fleet dashboards, field worker tracking, IoT sensor maps, and asset monitoring systems that push location updates to the browser via WebSockets — no page refresh, no polling, just instant map updates the moment a coordinate changes anywhere in the world.
Build Your Tracker3D Terrain & Globe Rendering
Immersive 3D terrain visualizations, satellite-textured globes, building extrusions, and fly-through animations built with Cesium.js and Three.js — for smart city digital twins, urban planning, archaeological site mapping, and aerospace applications.
Build in 3DGIS Data Processing & ETL
Automated geospatial data pipelines that ingest, clean, transform, reproject, and publish spatial data from any source — satellite imagery, drone footage, CSV coordinates, government datasets, sensor feeds, and legacy CAD files — into standardized formats ready for your map platform.
Build Your Pipeline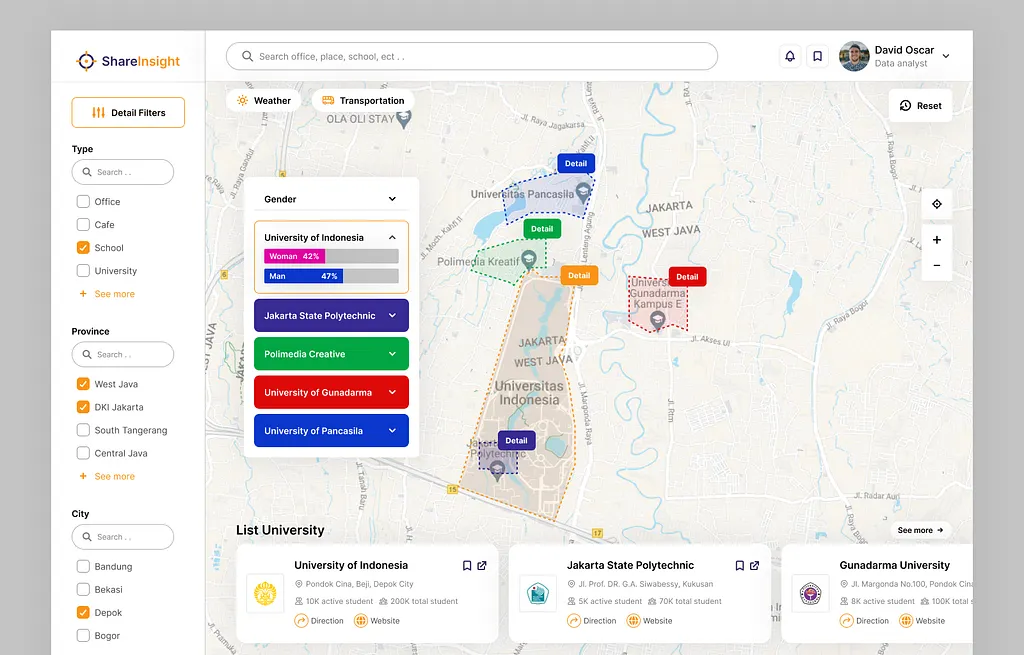
From Raw Coordinates
To Actionable Intelligence.
We don't just put dots on a map. We design spatial systems that run PostGIS queries across millions of geometries in sub-second time, serve vector tiles at scale, process real-world sensor streams, and surface the patterns that drive smarter decisions.
Every Industry Has
A Location Problem.
Spatial data is not just for mapping companies. Every industry generates location data — and most of it sits unused in spreadsheets. We build the GIS platforms that unlock it, turning coordinates into competitive intelligence.
Served
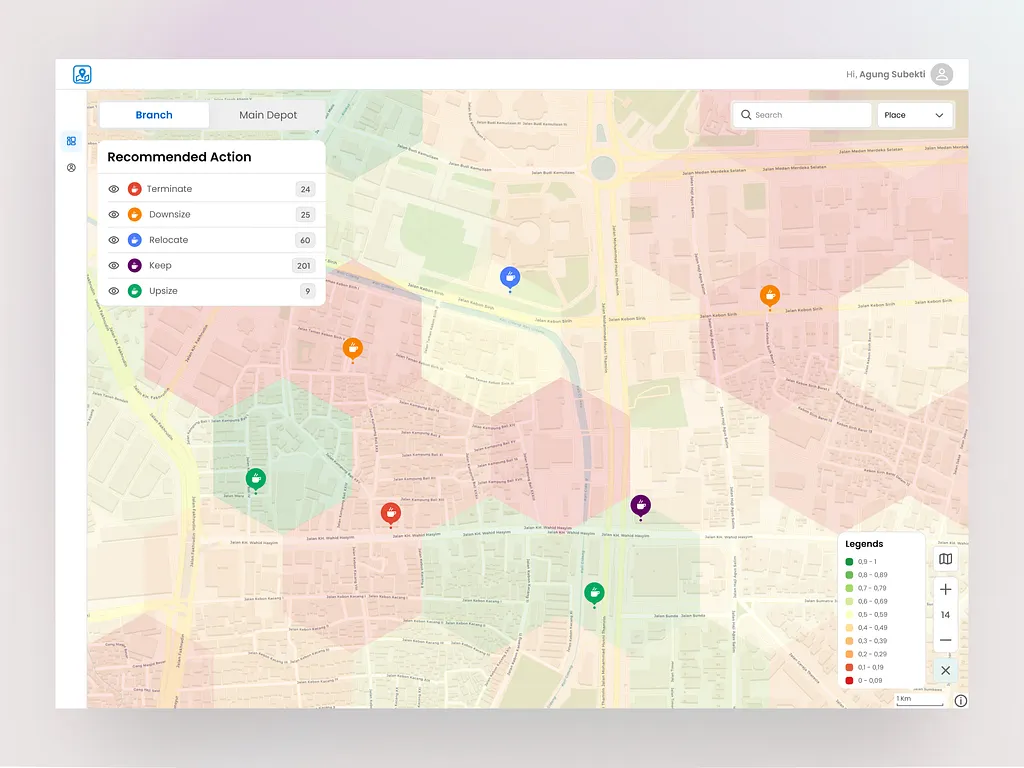
Real Estate
Property values vary by proximity to amenities, flood zones, school catchments, and transit corridors — but most PropTech platforms and agencies operate with zero spatial visibility, leaving competitive intelligence locked in coordinates they can't read.
- Property heat maps, comparable sales layers & price gradient overlays
- Catchment analysis, school boundary & flood zone risk mapping
- Walkability, transit access & amenity proximity scoring engines
Urban Planning
City planners and developers need to understand how infrastructure decisions ripple across neighborhoods — but zoning changes, density analysis, and transit impact studies still happen in disconnected spreadsheets and static PDFs with no spatial layer.
- Zoning maps, development feasibility layers & land use dashboards
- Population density visualization & infrastructure capacity planning
- Smart city digital twins & multi-agency collaboration platforms
Logistics
Last-mile delivery accounts for 28% of total logistics spend — yet most fleets have zero real-time spatial visibility of their vehicles, geofenced zones, or route efficiency. Location data exists but nobody can see it on a map.
- Real-time fleet dashboards with live vehicle positions & geofence alerts
- Route optimization, dwell-time analysis & driver scoring maps
- Last-mile delivery tracking & warehouse network spatial analysis
Agriculture
Farmers apply fertilizer and water uniformly across entire fields — but soil quality, moisture levels, and crop health vary by the meter. Precision agriculture requires sub-field spatial intelligence that legacy tools simply cannot provide.
- Precision farming dashboards with NDVI & multi-spectral satellite layers
- Soil moisture & crop health overlays with field boundary management
- Irrigation optimization maps & yield prediction spatial analytics
Environmental
Regulators, NGOs, and environmental agencies generate vast spatial datasets — deforestation boundaries, air quality readings, biodiversity surveys — but they sit in static reports, invisible to the decision-makers who need to act on them in real time.
- Real-time air quality & pollution dispersion monitoring dashboards
- Deforestation change detection & biodiversity layer platforms
- Water resource management & climate risk spatial analysis tools
Construction
Construction project managers need real-time visibility of equipment locations, crew movements, and site progress across dozens of simultaneous projects — yet most work from static PDF drawings and phone calls with zero live spatial awareness.
- Site survey maps, BIM geo-referencing & as-built spatial records
- Real-time equipment tracking & project progress heat maps
- Multi-site portfolio dashboards & subcontractor zone management
Public Health
Disease outbreaks, vaccination gaps, and health inequality all spread through communities with clear geographic patterns — but public health agencies rarely have the spatial tools to detect these patterns before they become crises.
- Disease outbreak mapping & epidemiological spread visualization
- Hospital catchment analysis & healthcare access equity maps
- Vaccination coverage visualization & underserved population layers
Energy & Utilities
Energy infrastructure spans thousands of square kilometers — but grid operators and utilities have no real-time spatial view of where faults, outages, and inefficiencies live. Pipeline anomalies and renewable site decisions still happen without a map.
- Pipeline network mapping & real-time grid infrastructure visualization
- Renewable energy site suitability & solar/wind resource analysis
- Outage management maps & fault location dashboards for operators
Data Audit to
Live Map Platform.
Every GIS project follows the same disciplined 5-step delivery process — from spatial data audit to production deployment — with fixed milestones, documented deliverables, and weekly progress reviews. No scope creep, no surprise timelines. Ships on schedule, every time.
Spatial Data Audit & Requirements
We audit your existing data sources, coordinate reference systems, formats, and volumes — then define the map types, layer structure, query requirements, performance targets, and integration points before a single line of code is written.
Output → GIS Architecture Document + Data ModelSpatial Database Design & ETL
PostGIS schema design with optimized spatial indexes, geometry types, and projection choices. Automated ETL pipelines to ingest data from all sources — CSV, Shapefile, GeoJSON, satellite imagery, GPS streams, or legacy databases — cleaned, reprojected, and validated.
Output → Production Spatial Database + ETL PipelineMap UI, Layers & API Development
Frontend map interface built with Leaflet.js, Mapbox GL, OpenLayers, or Cesium.js — layer controls, search, filters, and analytics panels. REST or GraphQL spatial API serving vector tiles, GeoJSON, and WMS/WFS endpoints at scale.
Output → Working Map Interface + Spatial APIIntegrations, Analytics & Real-Time
Connect your map to external sources — GPS feeds, IoT sensors, satellite imagery APIs, weather services, government open data portals — and wire up analytics panels, real-time update streams, geofence alerts, and reporting dashboards.
Output → Fully Integrated Live Map SystemDeployment, Performance & Support
Production deployment on cloud infrastructure with spatial query optimization, tile caching, CDN configuration, load testing, and monitoring setup. Ongoing support for data updates, new layer additions, and feature enhancements after launch.
Output → Live Platform + Full Documentation + Support SLA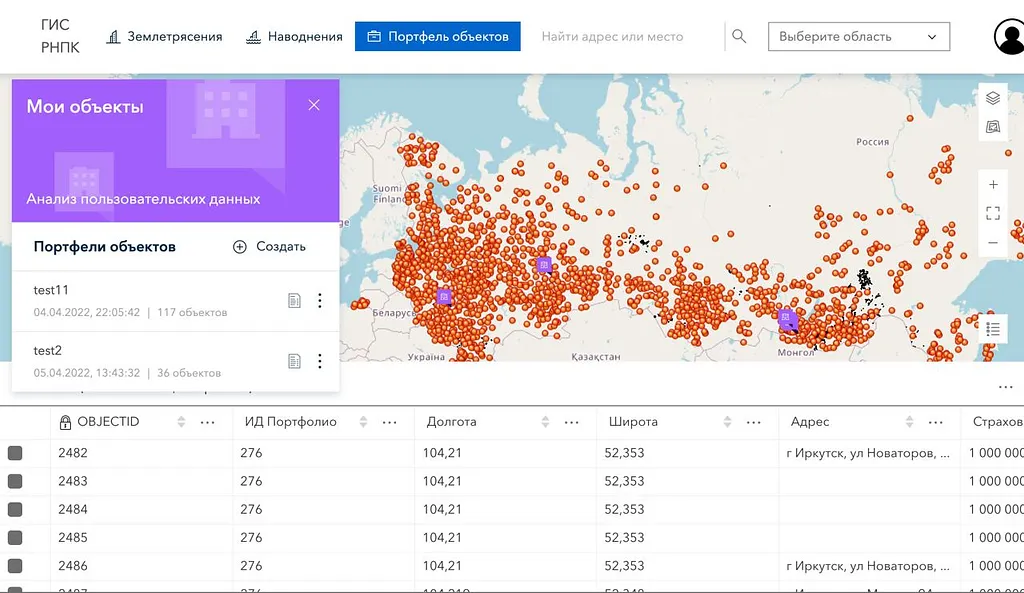
Where Data Has
Coordinates, We
Build The Map.
Most web agencies can embed a Google Map. We design enterprise-grade spatial systems that handle millions of geometries, serve real-time location streams, execute complex PostGIS queries in milliseconds, and scale to thousands of concurrent users — without compromise.
Enterprise Tools.
Spatial Expertise.
From the mapping library in your browser to the PostGIS cluster processing your geometries — we use the exact same tools trusted by Google Maps, Uber, and the world's leading GIS agencies. Four complete layers. One integrated stack.
32 tools. 4 layers. 1 team. We own every layer of your GIS stack — no vendor lock-in, no outsourced components. From the first map tile to the last spatial query.
Discuss Your StackYour GIS Questions,
Answered.
Everything you need to know about building a Web GIS platform with DartSyn — from data formats to deployment timelines.
A Web GIS platform is a browser-based application that visualizes, analyzes, and manages spatial data on interactive maps. DartSyn builds mapping dashboards, spatial analytics engines, fleet tracking systems, 3D terrain viewers, real-time monitoring maps, geospatial data pipelines, and custom tile servers — for real estate, logistics, agriculture, environmental monitoring, and more.
Frontend: Leaflet.js, Mapbox GL JS, OpenLayers, Cesium.js, deck.gl. Spatial databases: PostGIS, PostgreSQL, GeoServer, GDAL. Processing: Python, Shapely, GeoPandas, Rasterio. Formats: GeoJSON, Shapefile, GeoTIFF, WMS, WFS, KML — we select the right tool for your dataset size, performance requirements, and browser target.
Yes — live fleet tracking, asset monitoring maps, IoT sensor heat maps, and field worker tracking using WebSockets and MQTT. Location updates reach the map in milliseconds with zero page refresh. We also build geofence alert systems, route replay, dwell-time analytics, and driver scoring dashboards on top of the live stream.
Urban planning, logistics, agriculture, real estate, environmental monitoring, construction, oil and gas, disaster management, public health, and transportation. DartSyn has built GIS solutions across 10+ verticals — if your business generates location data, there is almost certainly a spatial platform that unlocks competitive value from it.
Yes — ERP systems, CRM platforms, IoT networks, satellite imagery APIs (Google Earth Engine, Sentinel, Planet), weather feeds, government open-data portals, and any REST or GraphQL API. We also build bidirectional sync — so actions on your map (drawing a polygon, dropping a pin) can trigger workflows in external systems in real time.
A focused single-map dashboard with PostGIS backend and static data layers ships in 3–5 weeks. A full enterprise GIS platform with real-time tracking, analytics, satellite imagery integration, and multi-tenant access takes 10–16 weeks. We always provide a fixed milestone timeline before development begins — no moving targets, no open-ended retainers.
Let's Put Your
Data On The Map.
Whether you have a full geospatial platform spec or just a location dataset you don't know what to do with, our founders personally jump on every first call. No sales reps. No demos. Just a real conversation about your spatial data, what it's worth, and exactly how to turn it into a platform that drives decisions.